Read a few anomaly detection papers and you’ll meet F0.5 everywhere. It’s a handy number. It’s also easy to misread.
A score of 0.6 does not mean “right 60% of the time”. It blends the answers to two separate questions:
- Precision: of the alarms raised, how many pointed at something real?
- Recall: of the real problems, how many got caught?
The 0.5 in F0.5 makes precision count twice as much as recall. For operations that’s a sensible choice: every false alarm costs someone’s attention, and attention runs out.
Two made-up detectors
Picture two detectors, each watching a year of telemetry that holds 100 real anomalies.
| Detector A | Detector B | |
|---|---|---|
| Alarms raised | 38 | 171 |
| Real anomalies among them | 30 | 94 |
| Anomalies missed | 70 | 6 |
| F0.5 | 0.6 | 0.6 |
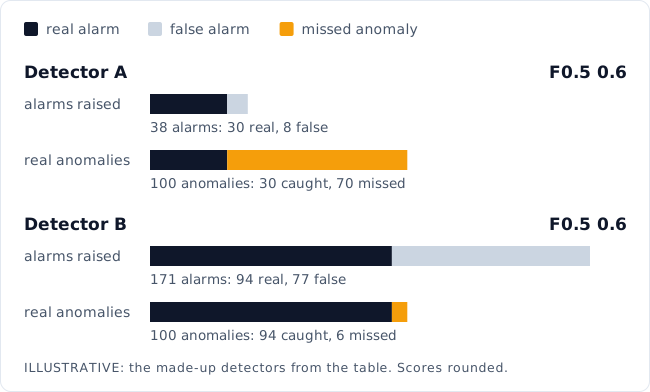
Same score, very different days at the console.
Detector A is calm. When it speaks it’s usually right, about 4 times in 5, but it lets most problems slip past.
Detector B misses almost nothing. To do that it raises more than four times as many alarms, and nearly half of them are noise.
So which one is better?
Neither, on its own. It depends on what a missed anomaly costs you compared with an hour of an operator’s time, and only the people running the mission can weigh that. A single score makes that call for them without anyone noticing.
That’s why we put both numbers next to every score we report, in plain words, like the table above.
And if someone hands you a single score, ours included, there’s a friendly question that always helps: what are the two numbers behind it?
The two detectors are invented to make the point, and the scores are rounded. For the curious: F0.5 = 1.25 × P × R / (0.25 × P + R), where P is precision and R is recall.
TupleTrace builds anomaly detection for spacecraft telemetry that explains every alert. See how it works, or download the brochure.